Noble:
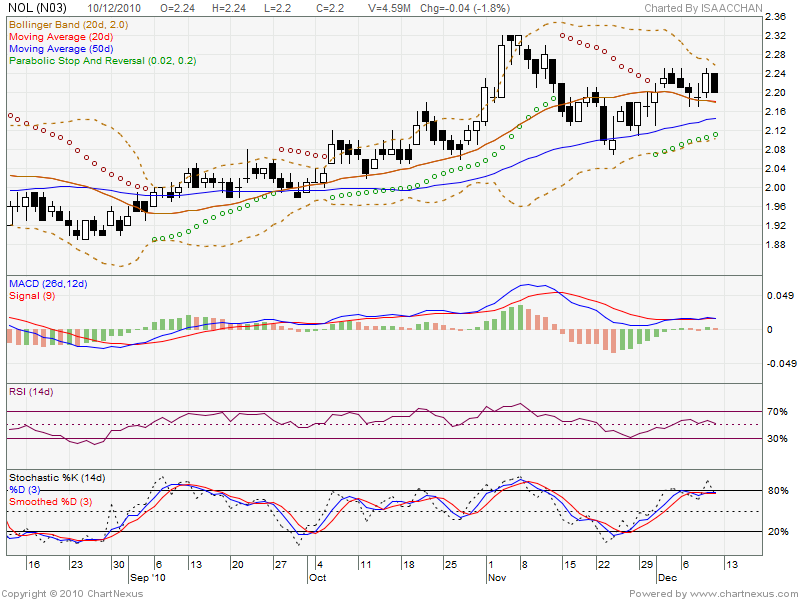
Dropped on high volume today despite having a new SWF buying over 50,000,000 units of Noble Group.
Strong support seen at $1.98 to $2.00 region, which coincidentally coincides with the lower channel line.
This one looks good. I will enter should prices drop to that region.
Golden Agri:
Another counter close to a strong support.
Strong support eyed at 63c.
Seems to be consolidating around 65c level.
Will consider entering should prices weaken to 63c
CapitaMallsAsia:
this one is another close to support.
Indicators wise, all three counters paint a similar picture:
- declining MACD, the latter two in negative region whilst Noble in positive region
-Bullish divergence for force index
-oversold stochastics.
Of these three, Noble looks the most compelling should it reach it's target price (Longer term picture is of an uptrend as opposed to downtrend for CMA). I will revisit them again if they reach target price...
Showing posts with label Golden Agri. Show all posts
Thursday, May 5, 2011
Saturday, April 30, 2011
Potential Short Term Trade: Golden Agri
Let's first look at GAR's weekly chart.
We can see that GAR is on a long term uptrend, and hence, two choices here: trade from long side or step aside.
I will choose to go long on GAR, explained on the daily:
We shall look at the indicators first:
The Force Index (Long Term) shows a nice bullish divergence, indicating lack of power in pushing the price down.
The MACD lines show no divergence, they rise as price rise.
The RSI also show no divergence.
Stochastics show a deeply oversold condition.
However, oversold can remain oversold for a long time. Just look at Wilmar.
Indicators don't show any juicy bullish divergences, yet what I like about this potential trade:
1.) GAR is very close to it's strong support at 65c. Look at the line I drew.
2.) When GAR was bullish in 2009 and 2010, it bounced from value zone to upper channel line. Likewise, when GAR was bearish this year, it bounced between value zone and lower channel line.
Looking at the chart now, GAR is slightly below the value zone. I daresay we've resumed the bullish trend of STI now. Hence, prices should trade between upper channel line and value zone, in a uptrend.
Target Entry Price for this trade: 65c to 66c
Profit Taking target for this trade: Midpoint between Upper channel line and value zone @ 70c to 71c
Stop Loss: 61c, though I don't expect it to go there.
Labels:
Golden Agri,
Short Term Trade,
TA
Friday, December 10, 2010
SembMar warrant sold
So today, SembMar went up to almost as high as yesterday's high. Sold off my warrants at 0.490 each, a 22% profit after taking brokerage fees into account.
However, my other STI component stock didn't do too well today, NOL, and I'm hoping that it'll bounce back next week.
My mistake, after using chartnexus to plot NOL, was buying at the resistance.
However, The technical indicators for NOL seem to be bullish, yet, NOL keeps decreasing day by day! sigh.
Anyway, for NOL:
As you can see:
MACD is above 0, MACD line is slightly, just slightly, above the signal line. Both above 0, so this is a bullish sign.
RSI: No trend.
20day MA and 50day MA both below stock price
Stochastic essentially giving same signs as MACD
PSAR: Bullish.
Yet, stock price is falling!
Oh well, I've decided to cut my loss at 0.225-0.230 region next week.
Next target for momentum trading will be Keppel Corp, IndoAgri and Olam, all of which fell today.
Labels:
Golden Agri,
IndoAgri,
Keppel Corp,
NOL MBL eCW110303,
Olam,
semb mar,
SGX,
Warrants
Subscribe to:
Posts (Atom)