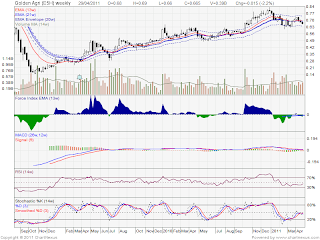
Let's first look at GAR's weekly chart.
We can see that GAR is on a long term uptrend, and hence, two choices here: trade from long side or step aside.
I will choose to go long on GAR, explained on the daily:
We shall look at the indicators first:
The Force Index (Long Term) shows a nice bullish divergence, indicating lack of power in pushing the price down.
The MACD lines show no divergence, they rise as price rise.
The RSI also show no divergence.
Stochastics show a deeply oversold condition.
However, oversold can remain oversold for a long time. Just look at Wilmar.
Indicators don't show any juicy bullish divergences, yet what I like about this potential trade:
1.) GAR is very close to it's strong support at 65c. Look at the line I drew.
2.) When GAR was bullish in 2009 and 2010, it bounced from value zone to upper channel line. Likewise, when GAR was bearish this year, it bounced between value zone and lower channel line.
Looking at the chart now, GAR is slightly below the value zone. I daresay we've resumed the bullish trend of STI now. Hence, prices should trade between upper channel line and value zone, in a uptrend.
Target Entry Price for this trade: 65c to 66c
Profit Taking target for this trade: Midpoint between Upper channel line and value zone @ 70c to 71c
Stop Loss: 61c, though I don't expect it to go there.
Showing posts with label Short Term Trade. Show all posts
Showing posts with label Short Term Trade. Show all posts
Saturday, April 30, 2011
Wednesday, February 16, 2011
Sembcorp Industries: Potential Short Term Trade
I've identified Sembcorp Industry as a potential short term trade.
Following Alexander Elder's triple screen trading system, let's go systematically:
1.) Find the Market Direction and trade with the market tide
Basically, if said stock is on uptrend, trade only from the long side. If Stock is on a downtrend, look for opportunities to short.
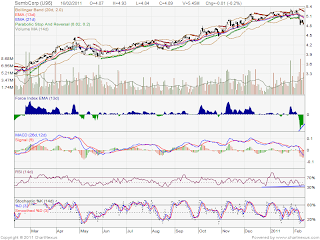
Let's have a look at Sembcorp Industries' Weekly chart:
As you can see from my blue line, the long term uptrendline is still intact, and Sembcorp Industry is currently hovering over it's uptrendline support. 13week EMA is also up.
Second Screen- Identify a Market wave that is against the tide
Like Salmon swimming upstream, a wave that is against the tide is bound to dissipate. So let's have a look at Sembcorp's Daily chart:
According to Dr. Elder, for oscillators like Elder Ray, Stochastics and Force Index, on an uptrend, take only BUY signals and ignore SELL signals(vice versa for downtrends). MACD Histogram for uptrends should also be at lows, but ready to turn up. He considers MACD histogram and divergences more important than crossovers and the like.
For those familiar with Triple Screen, we are in the autumn season.
For Sembcorp, let's have a look at MACD first. MACD is at oversold region, and the 2 lines show no sign of turning up. However, MACD histogram shows oversold bars that may or may not be ready to turn up.
Oscillator wise, I have 2 on the chart. Elder recommends we BUY when Force Index is negative on an uptrend. Looking at the chart again, Force Index is negative but upturning. As an added bonus, Force Index also shows a bullish divergence. I've used the 2day EMA to smooth things out, but editing FI to 13 day eMA also shows a bullish divergence.
Stochastics also shows oversold region, indicating a BUY on daily chart.
Hence, second screen shows an almost unanimous BUY signal.
Third Screen-
The Third Screen is basically where to put your stops and buy stops.
Elder recommends BUY when uptrend is intact, a retracement is occuring and BUY signal is indicated, unless multiweek lows are reached. In this case, Sembcorp Ind. is at it's lowest level since 11 weeks ago. So it's a question mark regarding the multiweek low thing.
If I do enter this trade, Elder recommends having a BUY stop order at 1 tick above today's closing price to catch any upside breakout, and BUY order will NOT be filled if there's a downside breakout. Hence reduces the trader's risk, at the expense of a few ticks profit.
For Singapore Market I doubt we have this kind of buy order, so it must be done manually.
So what should my buy price be? Today's HIGH was $4.93, so I should be buying ONLY when prices reach 4.94/4.95 bid/ask. If tomorrow downside breakout, I won't be caught, but I'll be sacrificing that few ticks of profit.
What should be stop loss be then? Elder recommends stop loss 1 tick below the low of the past 2 days, whichever is lower. Looking at Sembcorp, my stop should be when Bid/Ask is 4.81/4.82.
This leaves me with a total downside risk of $160 per lot if the trade goes awry ($4.95 to $4.81), with a target sell price of around $5.10 to $5.20, a reward of $150 to $250 a lot. (includes round trip commission) This leaves me with Risk/Reward Ratio of roughly 3:4, not very good actually.
I will see how it goes tomorrow. :)
Readers who would like to open an OptionsXpress account to trade in the US Market, kindly contact me :)
OptionsXpress commission is USD 14.99, lower than E*Trade, and also they have an office in Singapore, so fund transfer can be done via I-banking or Singapore Dollar Cheque with no TT Fees. Currency Exchange is also done at the JP Morgan Institutional Rate, which offers a spread tighter than what you can exchange on your own.
Subscribe to:
Posts (Atom)


