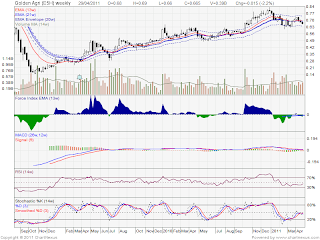
Let's first look at GAR's weekly chart.
We can see that GAR is on a long term uptrend, and hence, two choices here: trade from long side or step aside.
I will choose to go long on GAR, explained on the daily:
We shall look at the indicators first:
The Force Index (Long Term) shows a nice bullish divergence, indicating lack of power in pushing the price down.
The MACD lines show no divergence, they rise as price rise.
The RSI also show no divergence.
Stochastics show a deeply oversold condition.
However, oversold can remain oversold for a long time. Just look at Wilmar.
Indicators don't show any juicy bullish divergences, yet what I like about this potential trade:
1.) GAR is very close to it's strong support at 65c. Look at the line I drew.
2.) When GAR was bullish in 2009 and 2010, it bounced from value zone to upper channel line. Likewise, when GAR was bearish this year, it bounced between value zone and lower channel line.
Looking at the chart now, GAR is slightly below the value zone. I daresay we've resumed the bullish trend of STI now. Hence, prices should trade between upper channel line and value zone, in a uptrend.
Target Entry Price for this trade: 65c to 66c
Profit Taking target for this trade: Midpoint between Upper channel line and value zone @ 70c to 71c
Stop Loss: 61c, though I don't expect it to go there.


Hi Isaac,
ReplyDeleteI gave my word that I would comment, so here goes:
1. From the weekly, I don't see a clear uptrend. Maybe it's consolidating and going sideways for now. It did show that the recent price weakness comes with weak volume, so the most significant support level should hold. On daily, there's a slight uptrend. I trust the longer timeframe more than shorter one.
2. You mentioned that 65 is a strong support, but twice it had been broken around end Feb and mid Mar. Maybe you should shift the support to the level at mid march instead of seeing 65 as a support now. The most recent support is the more significant one, rather than one that is in Oct 2010.
3. In bullish state, prices always bounce from value zone to upper envelope. I don't see how STI being bullish (let's not even question why STI is bullish in the first place) affects GAR being bullish. Might have something to do with each other, might have nothing to do with each other too. Either case, it's good enough to view the chart as it is. And the chart didn't show a clear reversal yet. At best, it's showing that the selling is muted.
4. You should slap on the 200d ema. The price is sitting right on top of the moving average line, thus we're at a crucial support level, one that is based not on horizontal support, but on based on moving trendlines. Should this break, we'll be seeing further selldown.
To conclude, I wouldn't touch it yet. If you put a gun to my head, then i'll buy a little to hedge against upside at 0.66. But that's just me, I see a different thing from you :)